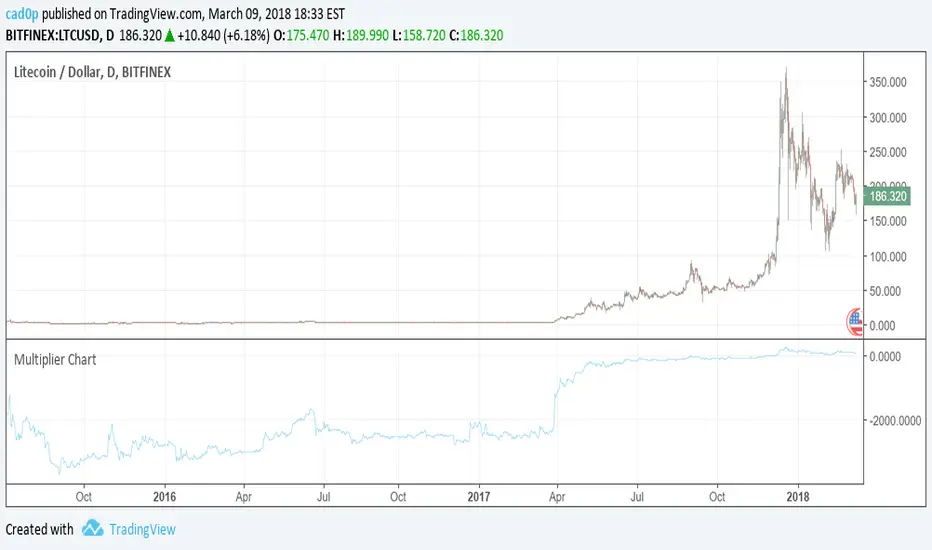
Multiplier ChartI am proposing an alternative to the percent change.
An alternative that is symmetrical to both positive and negative change, unlike percentage change.
The simple idea is to have a positive number if the reference value (called val in the script) is lower than the stock value and needs to be multiplied;
a negative number instead if the reference number is higher than the stock value, so the reference value needs to be divided.
Multiplying all by 100 to give clearer and more readable results, the Multiplier would have a huge gap between +100 and -100, because a stock multiplied by 1 or divided by 1 are the same thing.
So we need to compromise and move all positive numbers down by 100 and all negative numbers up by 100. This actually gives a similar result to percentage change, and it is actually identical in the positive range.
The fundamental difference lies on the negative range, which is completely symmetrical. So if a stock goes up 100 points one day (doubles), and the next it goes down another 100 points (halves), at the end of the second day the stock has the same value as it had at the beginning of the first day! On percentage change it would be +100% the first day and -50% the second.
We mustn't undervalue the human tendency to compare a 1% change to a -1% change, but they do not mean the same even if they seem to indicate so.
A clear example of this can be found on CMC 0.60% -3.56% -3.56% (CoinMarketCap), in which each day are shown the best and worst performing coins of the day. So you might see a +900% there in the top performing, but you'll never see a -900%, because percentage change cannot go further than -100%. It is a fundamentally asymmetric scale that can confuse people a lot especially in those fast moving new markets.ù
I am welcome to feedback and all kinds of opinions and critics.
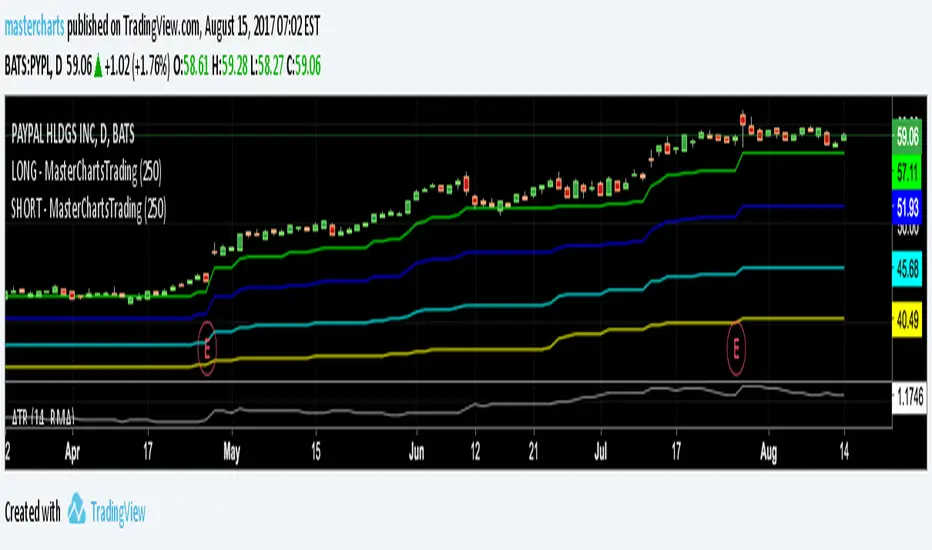
Some interesting things to note: you can use it as a percentage change indicator or as a different perspective to a stock chart. In fact, it lets you see how big of a difference it made buying coins when they were very cheap, because when they are cheap a difference of what it might seem nothing is amplified by all the gains that the stock/coin made after. So, looking at coins charts using this indicator shows how "not flat" were the early days, which in a normal chart are flattened to 0.
[i]price
Support and ResistanceThis script uses pivot point calculations to determine support and resistance areas.

First_4_fibo_IntradayMagic of first four 15 min candle H/L with FIBO !!
For Gainers :
Stocks Trading above 38.2 % are expected to touch Day's High.
Stocks Trading above 23.6 % are expected to make a new intraday High. (Tgt1 = 138.2%, Tgt2 = 161.8%).


dynFibo for Intraday - fpsintAutomatically adjusts fibo based on day H and L.
H
37.8 %
50.0 %
61.8 %
L
try out, any issues feel free to ping ! Happy Learning !
- fpsint

BTC Price Spread - Coinbase & Futs - Premiums & DiscountsThis indicator takes the price of Bitcoin on Coinbase and the futures price on Mex, and compares it the average price of Bitcoin across other major exchanges.
This essentials give us a spread at which Bitcoin is going for.
In turn, this could be a possible tool to help determine market sentiment.
This indicator was created for experimental purposes.
Use at your own digression.

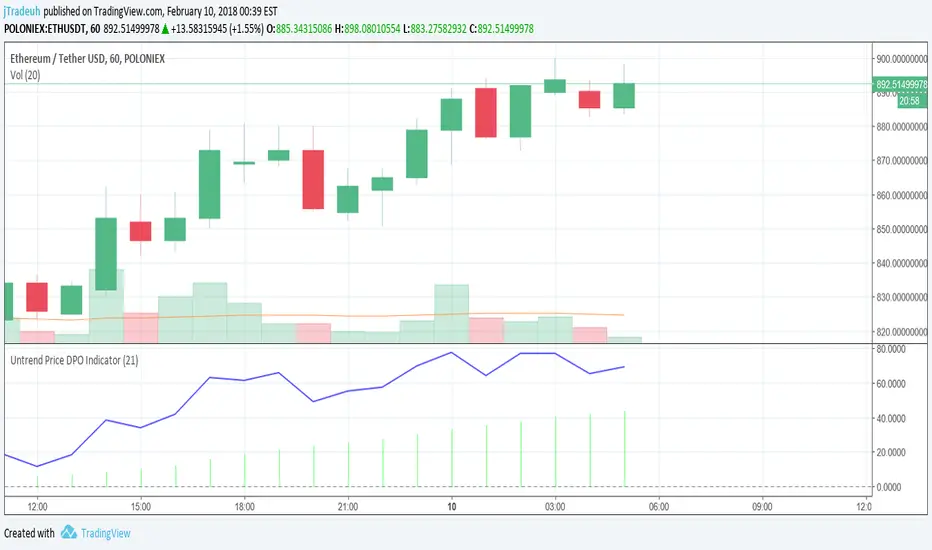
MPT - MEDIAN PRICE TRADING - custom forex indicator
MPT is a unique custom indicator i created to enter a trade with the right timing
This indicator catches the momentum of a Forex pair and tells you when to enter
It's based on the idea that when the median price in the current timeframe is crossing the median price of the higher timeframe, the momentum is changing and that is an opportunity to trade
red line is median line of current timeframe (default is 1D)
aqua line is projection of past median line on higher timeframe (default is 1W)
white crosses can be used as a trail stop values to follow a trend
when red cross aqua up the background is green and so momentum of the pair is up
when red cross aqua down no background color and momentum down
You can try this indicator for a limited period, just ask for access in comments
If you want unlimited access you can PM me
Trading is a risky business, use it at your own risk. I'm not responsible for any profit or loss


52 Week High/Low52 Week High / Low Indicator
A simple, unobtrusive indicator that can be used on any timeframe to display the 52 week high/low values.
Features
Works on any timeframe.
Unobtrusive: Simple horizontal lines showing only the current 52 week values.
Allows the user to select whether to calculate the 52-week values from candle close values or the respective highs/lows.
For full overview and code commentary - Visit the backtest-rookies website.

CB SDB HK VOL IndicatorIndicator version of designed for use with independent automation solution.
Custom development published for customer verification and acceptance.
If you are interested in development services, please visit the backtest-rookies website or message me to find out more.

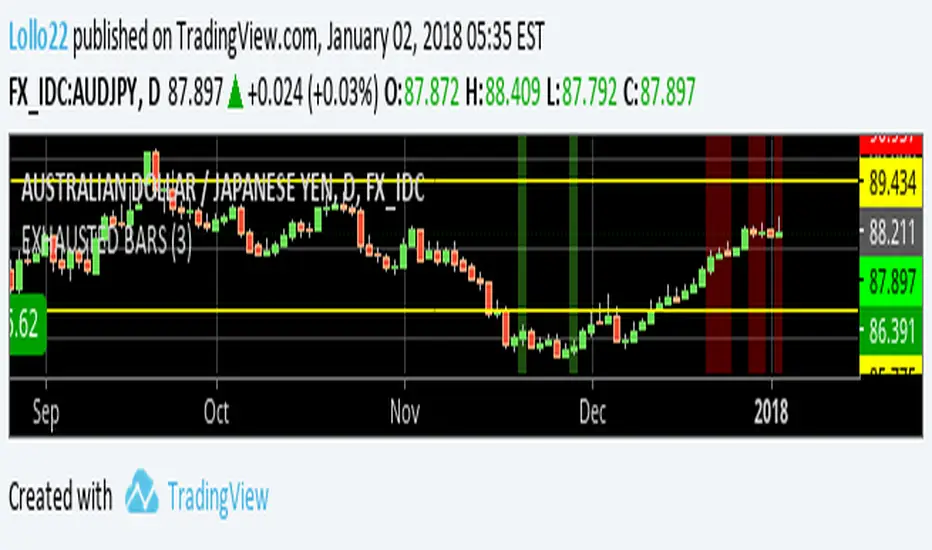
EXHAUSTED BARS - Exit candlestickThis script can spot the candle to exit a trade
it works only on 1d timeframe
Do not trade the signal, just use it to exit the trade in profit (it's not a reversal signal)
NO REPAINT - it' based on current candle close
You can try it for a limited period, ask for access in comments
X-LinesИндикатор X-lines давно известен для пользователей торговой платформы Metatrader 4 & 5. Он показывает интересные рынку цены (уровни поддержки и сопротивления). Индикатор работает без опоздания и как только бар будет закрыт по интересующей рынок цене, тут же над ним появится символ "X" и начнется прорисовка уровня до следующего важного значения . Уровни (цены) которые указывает индикатор являются истинно важными для рыночного процесса (по ним отрабатывается или отрабатывался в прошлом крупный объем сделок). Соответственно подобные цены в будущем могут быть целью торгового процесса и могут выступать, как поддержкой так и сопротивлением.
Настройка индикатора предельно проста, имеется возможность менять значение только одного параметра: Levels Power (сила уровней), по умолчанию значение равно 9-ти. Чем выше значение тем более слабые уровни показывает индикатор (соответственно уровней становится больше). В случае низких цифр индикатор показывает сильные и более важные цены (соответственно уровней становится меньше). Работу индикатора обеспечивает авторский алгоритм. Индикатор не строит уровни по вершинам цен или по краевым барам он автоматически и своевременно определяет отработку объема по цене закрытия бара тем самым обеспечивая практически 100% точность уровня.
Важно отметить, что в силу особенностей облачного языка PINE индикатор кое что потерял, а кое что приобрел. Для более удобной разметки уровней, просто расставите горизонтальные ценовые уровни соответственно показаниям индикатора.
English
The X-lines indicator has been long time known by users of the Metatrader 4 & 5 trading platform. It shows interesting market prices (support and resistance levels). The indicator works without delay and as soon as the bar is closed at the interesting price, immediately after that the symbol "X" will appear above bar and the level will be drawn to the next important value . The levels (prices) that the indicator showing are truly important for the market process (according to them, a large volume of transactions is processed or was working out in the past). Accordingly, such prices in the future can be the goal of the trading process and can act as support and resistance.
The adjustment of the indicator is extremely simple, it is possible to change the value of only one parameter: Levels Power, which default value is 9. The higher the value, the weaker the levels, the indicator (correspondingly, the levels becomes larger). In the case of low figures, the indicator shows stronger and more important prices (correspondingly, the levels are getting smaller). The work of the indicator is provided by the author's algorithm. The indicator does not build levels at the tops of prices or on edge bars, it automatically and in a timely manner determines the amount of work to be done at the closing price of the bar, thereby providing a nearly 100% level accuracy.
It is important to note that, due to the peculiarities of the cloud-based PINE language, the indicator has lost something, and has acquired something. For a more convenient level markup, simply place the horizontal price levels according to the indicator readings.

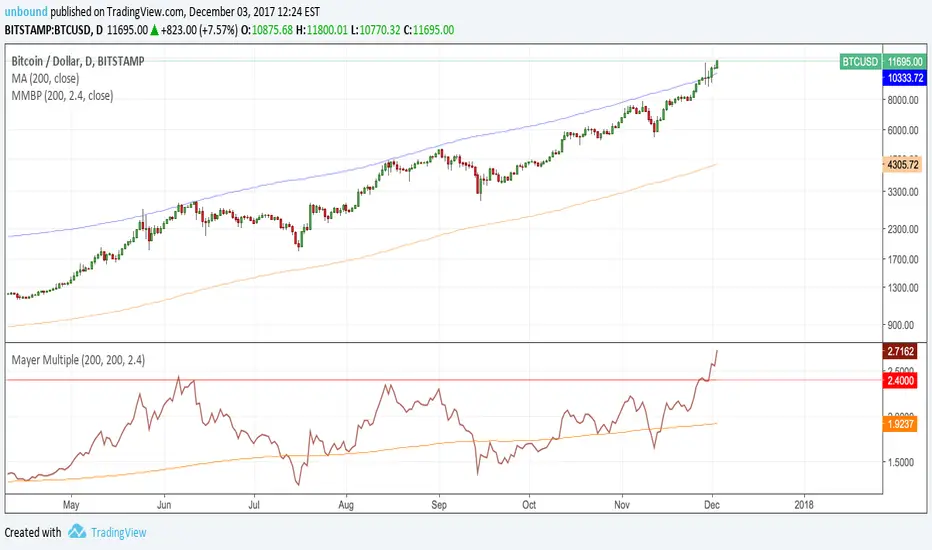
Mayer MultipleFollowing Preston Pysh's "Bitcoin Mayer Multiple" study, I made this simple script to plot the Mayer multiple by calculating the ratio between bitcoin price and its 200-day moving average. It also plots the moving average of ratio itself.
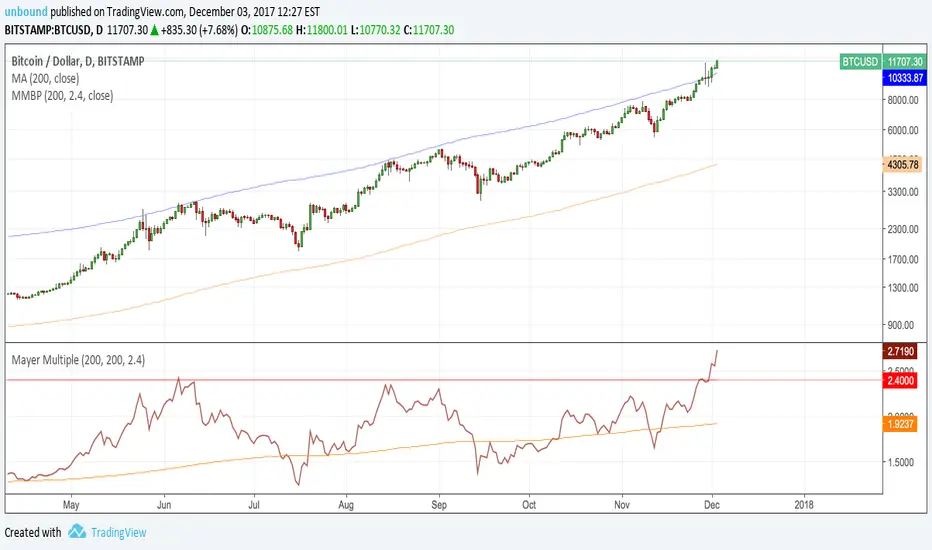
Mayer Multiple Buy PriceFollowing Preston Pysh's "Bitcoin Mayer Multiple" study, I made this simple script to plot the recommended buy price based on the calculated 2.4x ratio between bitcoin price and its 200-day moving average. The ratio and SMA length have default values of 2.4 and 200 and can be adjusted.
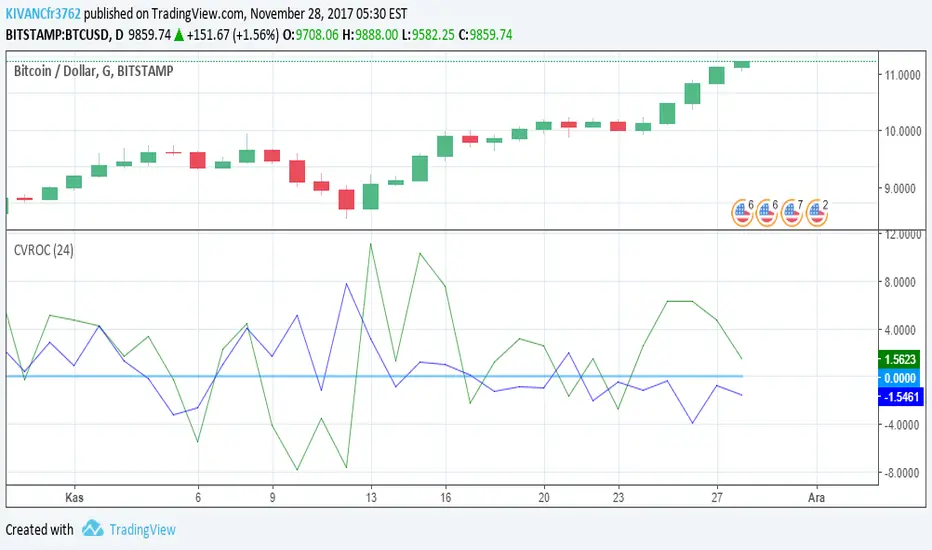
CVROC - Close Volume Rate Of ChangeIndicator designed for cryptotraders to understand whether if the price change is supported by the volume or not
deafult value os SMA of volume is 21 periods
which can be optimized by the user
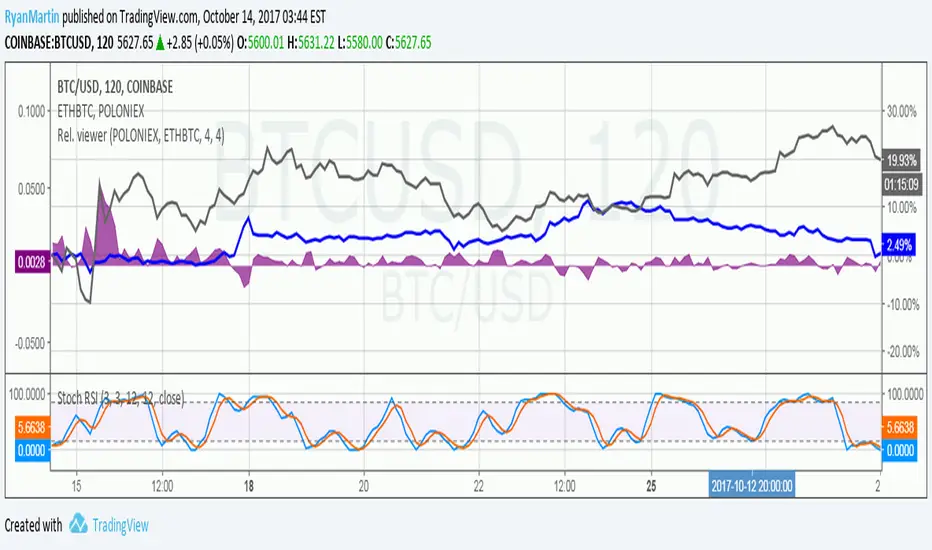
Price relation viewer - add percent change of two symbols (BETA)This script is very much beta!
This is a simple script to visualize how two symbols move in relation to each other. For example if the underlying symbol is a 2x Gold ETF (meaning the ticker moves at 2x the spot price of gold---if gold goes up 3% this ticker should go up 6%) and the comparison symbol is an 2x inverse gold ETF (at gold up 3% this should move down 6%). If these ETFs were 100% accurate at tracking the price of gold then this tool would report a value of zero at all times.
Day 1
Ticker - $10
Comparison - $10
Day 2
Ticker - $12
Comp - $11
This tool value - |20%| + -|10%| = 10%
It uses a short simple moving average to smooth things out a bit (see inputs). It is important to keep your axis scale in mind when using this! Two symbols that are always near zero mean they are offsetting each other very well but the value displayed might range from 0 to 0.005, but the graphed area can make it look extreme if autoscaled.
This is a tool with very specific uses : comparing how one digital currency moves in relation to bitcoin's price, comparing how gold moves in relation to silver, etc.

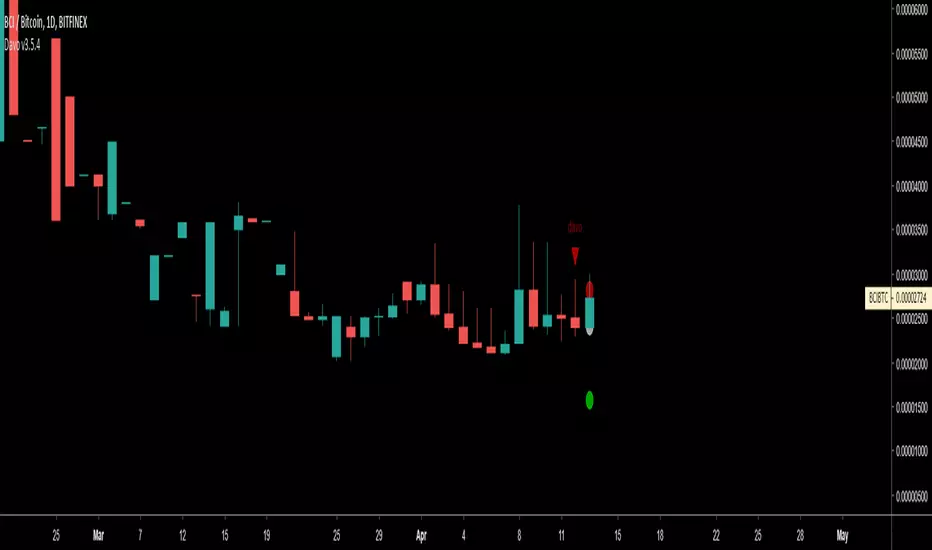
Dav-o meter (public)I decided to make this formerly invite only script public (you can find the invite only version here
If you are part of the invite only you don't need to change scripts. I will push improvements first on the invite only script but in time it will come to this version as well.
I would love to know your ideas and thoughts on how this indicator can be improved, so feel free to give any feedback.
Remember to give it a thumbs up if you like it.
CandleCheckThis indicator is intended to evaluate the quality of the bullish candles (close > open).
It will calculate the average size of the bullish candles from the last 200 periods. I'm assuming that a bullish candle with a superior wick or shadow equal or less than 25% of the total size of the bar is a good disruption candle. You can adjust at your own taste.
Candles with a size above the average and a superior wick or shadow equal or less than 25% of the total size of the bar will be painted lime. These are "good" candles.
Candles with a superior wick or shadow equal or less than 25% of the total size of the bar but with a size below the average will be painted green. These are "OK" candles.
Candles with a size above the average but a superior wick or shadow above than 25% of the total size of the bar will be painted fuchsia. These are "bad" candles.
Candles with a size below the average and a superior wick or shadow above than 25% of the total size of the bar will be left alone. These are "worse" candles.
"bad" and "worse" candles will be marked with a lime cross at the exact spot where price should reach to turn these candles to "OK" or "good". That value will be indicated at the indicator header.
"OK" or "good" candles should have a volume above the average.

Dav-o meterPseudo code
Example
General info and acknowledgements
Author: maqpie
Date of publishing: 20th of july 2017
This script is based upon Davinci's dav-o meter and his original script, which searches for W's and M's in price, OBV, RSI and/or Willy.
Although the original script is elegant, a W or M has to occur within 5 bars.
However, often what you will see is that a W or M forms over more than 5 bars.
This script tries to remove that limit.
It took me several different approaches to find a good solution. For the most part because of the lack of any real debugging tool in Pine script.
Let me know what you think, because I feel like I need tone down the number of options so it is easier to use.
If you have any questions, or things you would like to see different please contact me at TRI.
Have fun playing and goofing around with it!
How it works
Now, trading is more of an art form than a science and this indicator is no exception.
When talking about M's and W's, it begs the question: what exactly counts as a W or M?
My personal experience is that for a W to count as such, it has to adhere to the following rules:
1. A 'W' has 5 points, A, B, C, D and E E
2. Point A can be any point C /
3. Point B should be lower than A A / \ /
4. Point C should be higher than B \ / D
5. Point D should be lower than C, but higher than B B
6. Point E should be higher than C
1. A 'M' has 5 points, A, B, C, D and E B
2. Point A can be any point / \ D
3. Point B should be higher than A A \ / \
4. Point C should be lower than B C \
5. Point D should be higher than C, but lower than B E
6. Point E should be lower than C
Script input parameters
You can use the following indicators to search for W's or M's:
- price (close)
- OBV
- RSI
- Willy
For each of these indicators you set the following options:
- Use: whether you want to use it
- The maximum width: over how many bars a W / M is allowed to form
- The maximum offset: how many bars back a W / M is allowed to form
- Strict: when not set, rule 5 (see 'How it works') changes: point D no longer has to be above B (for W), and no longer has to be below B (for M)
- Length: length of the indicator, for example a 14 bar RSI
Other options:
- Potential dav-o: show potentials which are like regulars dav-o's, except that rule 6 (see 'How it works') no longer applies.
- Period: you can limit the period for backtesting. Useful to identify under what market conditions the script works best.
Final note: using the potential dav-o in combination with unsetting the 'Strict' rule will make this script all but useless.

Price and EMA Difference Customizable [Requested script]
Easy options, you can toggle the lines and other things. Even turn of the histogram.
